AxessPoint: Measuring liquidity in European corporate bond markets

By David Krein and Kyle Smyre | 27 April 2022
Text
Highlights
- Relative Liquidity Scores (RLS) are strongly correlated to traditional single liquidity metrics across all market segments that have historically been used as single proxies for liquidity.
- While RLS is not directly comparable across different bond markets, traditional liquidity metrics can be inferred to show the expected ability to execute a trade on a given bond.
Relative liquidity score methodology
The MarketAxess Relative Liquidity Score provides a defined measurement of the current liquidity for individual bonds and highlights the potential ease that a trader can expect to transact in that instrument. Available for Euro, Sterling and Dollar-denominated bond markets, our scoring method covers nearly 33,000 bonds daily, with scores ranging from one to ten, ten indicating the highest level of liquidity, one the least liquid. Market segments are scored separately, hence the relative nature of the scores. There are bond-specific factors which go into the calculation of RLS, such as market wide activity, MarketAxess platform inquiry activity, and platform dealer activity. Full information can be found on the product sheet for RLS.
Interpreting relative liquidity score
Despite the size of the fixed income markets, liquidity is segmented and fractured across counterparties. Individual ISINs can be quite illiquid – it’s rare for single corporate bonds to change hands daily.
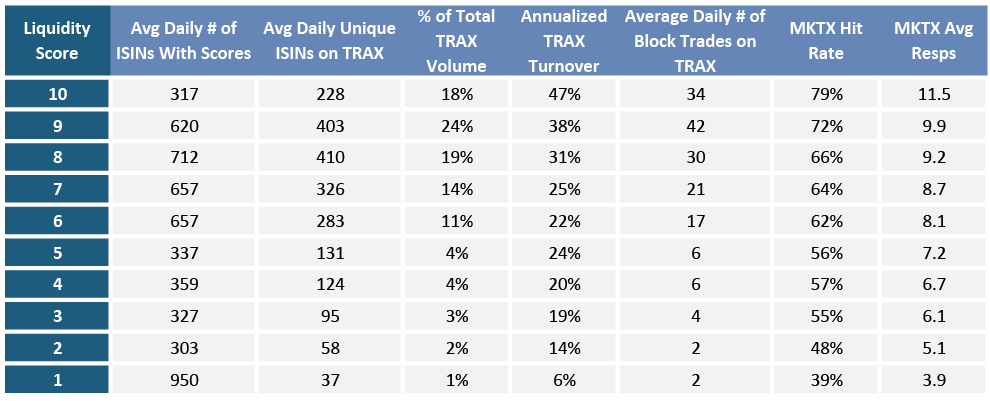
Figure 1: RLS Stat Sheet for February 2022 in EU IG
RLS aims to solve this by providing a single score which strongly correlates with varying different metrics which traders have historically used to approximate liquidity. For example, looking at EU RLS across February 2022 (Fig. 1), we see that RLS scores are strongly correlated to bid/ask as measured by MarketAxess CP+™ pricing, turnover, hit rates and average responses received back on client initiated RFQs. RLS can be used in conjunction with CP+, as the products share a similar selection criterion, so the bond universe overlap between RLS and CP+ is quite high. In Figure 2 below there is a clear trend of the average number of responses increasing, in line with general expectations of traditional liquidity measures. The amount outstanding, also shown in Figure 2, is another metric which suggests higher RLS bonds can be sourced more easily due to the larger issuance and availability.
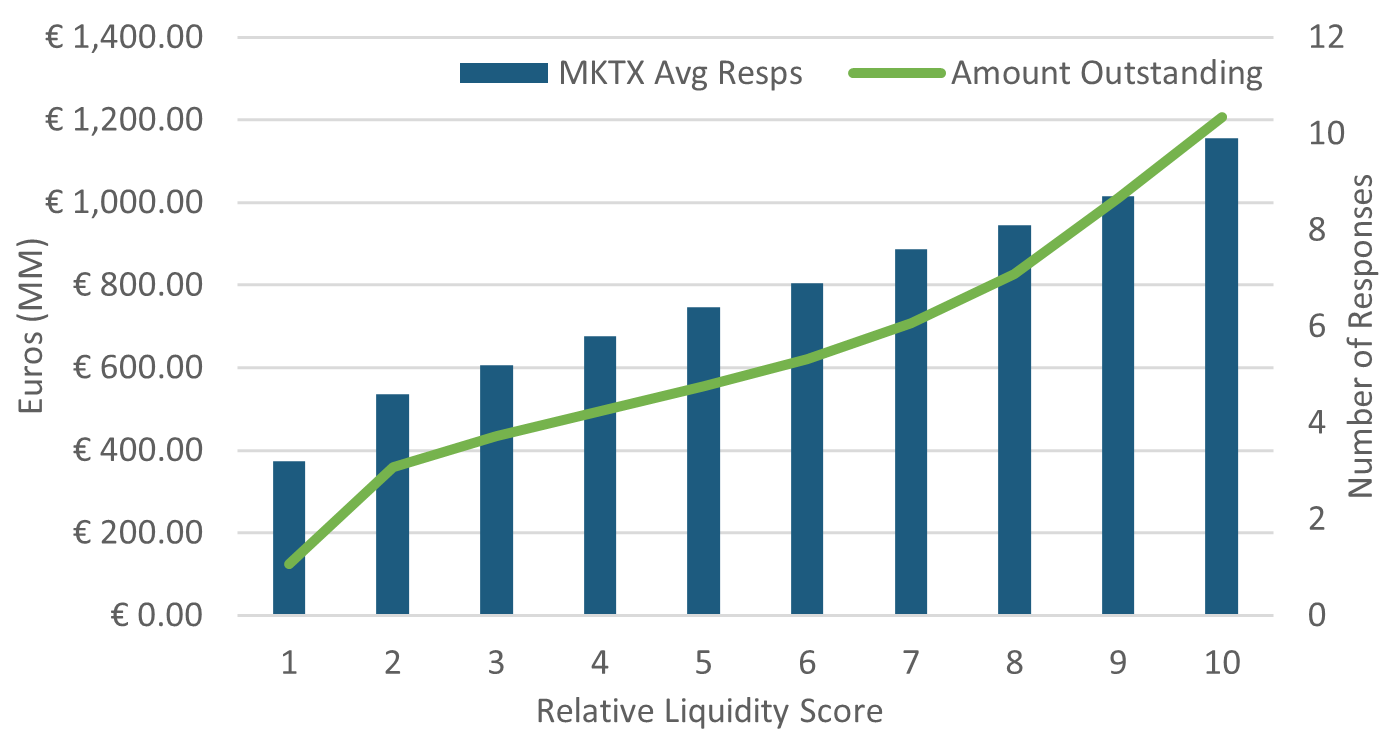
Figure 2: Amount outstanding and avg. responses by RLS for Feb 2022 in EU IG
For questions or follow-up, email our data scientists at info@marketaxessfinance.com